1- Overviews
- A full visual control of Data Acquisition/Capture NPB(6* 40GE/100GE QSFP28 slots plus 48 * 10GE/25GE SFP28 slots)
- A full pre-processing and re-distribution Packet Broker(bidrectional bandwidth 1.8Tbps)
- Tunnel Encapsulation Stripping supported, the VxLAN, VLAN, GRE, GTP, MPLS, IPIP header stripped in the original data packet and forwarded output.Supported raw packet collected, identified, analyzed, statistically summarized and marked
- Supported raw packet output for monitoring equipment of BigData Anlysis, Protocol Analysis, Signaling Analysis, Security Analysis, Risk Management and other required traffic.
- Supported real-time packet capture analysis, data source identification, and real-time/historical network traffic search
- Supported P4 programmable chip solution, data compilation and action execution engine system. The hardware level support the recognition of new data types and strategy execution ability after data identification, can be customized for packet identification, quick add new function, new protocol matching. It has excellent scenario adaptation ability for the new network features. For example, VxLAN, MPLS, heterogeneous encapsulation nesting, 3-layer VLAN nesting, additional hardware level timestamp, etc.


2- Intelligent Traffic Processing Abilities
 VLAN Tagged
  ASIC Chip Plus Multicore CPU 1.8Tbps intelligent network traffic processing capabilities. Built-in multi-core CPU can reach up to 60Gbps intelligent traffic processing capacity
  Network Traffic Replication Packet replicated from 1 port to multiple N ports, or multiple N ports aggregated, then replicated to multiple M ports by Network Packet Broker
  Network Traffic Aggregation Packet replicated from 1 port to multiple N ports, or multiple N ports aggregated, then replicated to multiple M ports by Network Packet Broker
  Data Distribution/Forwarding Classified the incoming metdata accurately and discarded or forwarded different data services to multiple interface outputs according to user’s predefined rules.
  Packet Data Filtering Supported flexible combination of metdata elements based on Ethernet Type, VLAN Tag, TTL, IP seven-tuple, IP Fragmentation, TCP Flag, and other Packet Features fornetwork security devices, protocol analysis, signaling analysis, and traffic monitoring
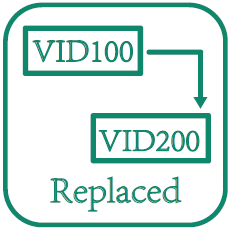
  Load Balance Supported load balance Hash algorithm and session-based weight sharing algorithm according to L2-L7 layer characteristics to ensure that the port output traffic dynamic of load balancing Video Traffic Filtering Supported to filter and mitigate the video stream data matching such as domain name address resolution, video transmission protocol, URL and video format, to offer useful data to analyzers and monitors for security. Supported the matching of any key field in the first 128 bytes of a packet. The user can customize the offset value and key field length and content, and determine the traffic output policy according to the user configuration.VLAN Untagged VLAN Replaced


 Single Fiber Transmission Support single-fiber transmission at port rates of 10 G, 40 G, and 100 G to meet the single-fiber data receiving requirements of some back-end devices and reduce the input cost of fiber auxiliary materials when a large number of links need to be captured and distributed
 Data/Packet De-duplication Supported port-based or policy-level statistical granularity to compare multiple collection source data and repeats of same data packet at a specified time. Users can choose different packet identifiers (dst.ip, src.port, dst.port, tcp.seq, tcp.ack)
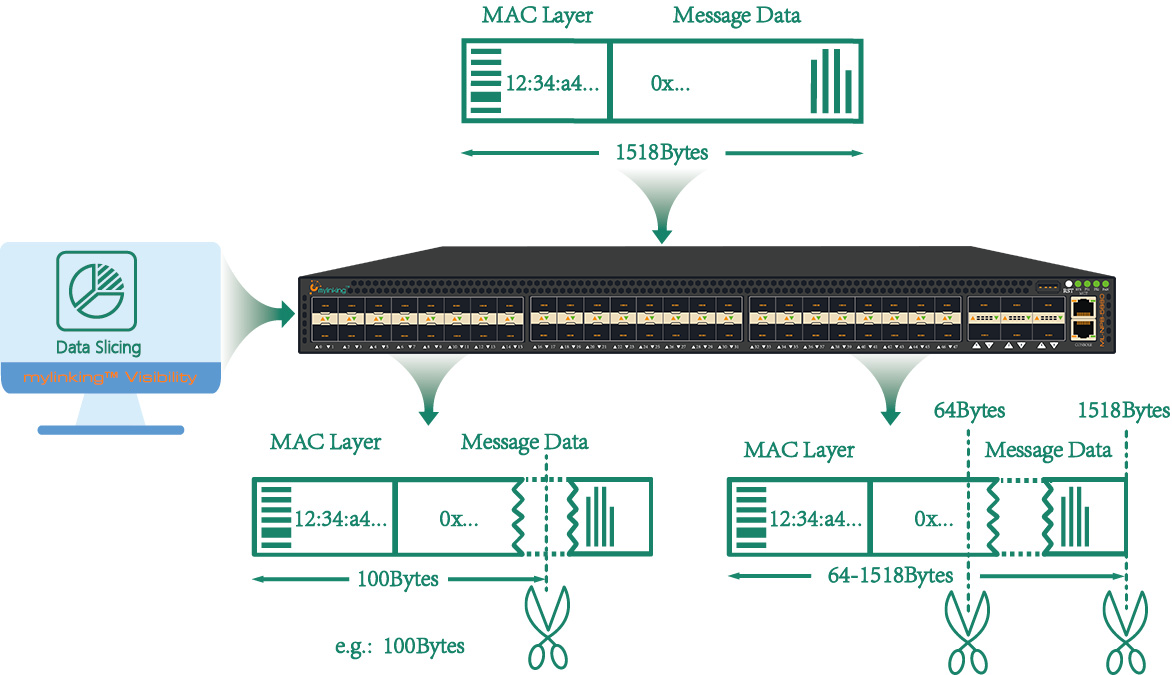
 Data/Packet Slicing Supported policy-based slicing (64-1518 bytes optional) of the raw data, and the traffic output policy can be implemented based on user configuration
 Classified Date Masking Supported policy-based granularity to replace any key field in the raw data in order to achieve the purpose of shielding sensitive information. According to user configuration, the traffic output policy can be implemented. Please visit "What’s the Data Masking Technology and Solution in Network Packet Broker?" for more details.
  Mylinking™ Visibility Platform Supported Mylinking™ Matrix-SDN Visual Control Platform Access
 Tunneling Protocol Identification Supported automatically identify various tunneling protocols such as GTP / GRE / PPTP / L2TP / PPPOE/IPIP. According to the user configuration, the traffic output strategy can be implemented according to the inner or outer layer of the tunnel
  10GE/25GE/40GE/100GE Traffic Data Capure 6 slots 100GE QSFP28 plus 48 slots 10GE/25GE SFP28 up to 1.8Tbps Traffic Data Transceiver at same time, for network Data Capture, simple Pre-processing
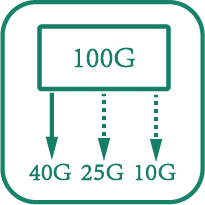
  Time Stamping Supported to synchronize the NTP server to correct the time and write the message into the packet in the form of a relative time tag with a timestamp mark at the end of the frame, with the accuracy of nanoseconds Port Breakout Supported 40G/100G port breakout function and can be split into four 10GE/25GE ports to meet specific access requirements
 Tunnel Encapsulation Stripping Supported the VxLAN, VLAN, GRE, GTP, MPLS, IPIP header stripped in the original data packet and forwarded output.
  APP Layer Protocol Identify Supported commonly used application layer protocol identification, such as FTP, HTTP, POP, SMTP, DNS, NTP, BitTorrent, Syslog, MySQL, MsSQL and so on
  SSL Decryption Supported loading the corresponding SSL certificate decryption. After the decryption of HTTPS encrypted data for the specified traffic, it will be forwarded to the back-end monitoring and analysis systems as required.
  User-defined Decapsulation Supported the user-defined packet decapsulation function, which can strip any encapsulated fields and contents in the first 128 bytes of a packet and output them
  Packet Capturing Supported real-time packet capture at the port and policy levels. When abnormal network data packets or abnormal traffic fluctuations occur, you can capture original data packets on the suspicious link or policy and download them to the local PC. Then you can use the Wireshark to quickly locate the fault.
  Traffic Trend Alarming Supported port-level, policy-level data traffic monitoring alarms by setting the alarm thresholds for each port and each policy flow overflow.
  Network Traffic Insights Supported visualization of the entire process of link data traffic from receiving, collecting, identifying, processing, scheduling, and output allocation. Through the friendly graphic and text interactive interface, multi-vision and multi-latitude display of traffic composition structure, traffic distribution on the whole network, packet identification and processing process status, traffic trends, and the relationship between traffic and time or business, transforming invisible data signals into visible, manageable and controllable entities.
  Traffic Monitoring and Detection Traffic monitoring provides real-time traffic situation monitoring capability. Traffic detection enables in-depth analysis of traffic data at different network locations, providing original data sources for real-time fault location
  Historical Traffic Trend Review Supported port-level, policy-level nearly 2 months of historical traffic statistics query. According to the days, hours, minutes and other granularity on the TX/RX rate, TX/RX bytes, TX/RX messages, TX/RX error number or other information to query select.
  Real-time Traffic Detection Supported the sources of "Capture Physical Port (Data Acquisition)", "Message Feature Description Field (L2 – L7)", and other information to define flexible traffic filter, for real-time capture network data traffic of different position detection, and will it will be storaged the real-time data after captured and detected in the device for downloading of further execution expert analysis or uses its diagnosis features of this equipment for deep visualization analysis.
  DPI Packet Analysis DPI in-depth analysis module of the traffic visualization detection function can conduct in-depth analysis of the captured target traffic data from multiple dimensions, and perform detailed statistical display in the form of graphs and tables Supported the captured datagram analysis, including abnormal datagram analysis, stream recombination, transmission path analysis, and abnormal stream analysis
  1+1 Redundant Power System(RPS) Supported 1+1 Dual Redundant Power System
4-Specifications
3.2 Unified Schedule Application(as following) 3.3 Data VLAN Tagged Application(as following)
 3.4 Data/Packet De-duplication Application(as following)
 3.5 Mylinking™ Network Packet Broker Data/Packet Masking Application(as following)
 3.6 Mylinking™ Network Packet Broker Data/Packet Slicing Application(as following)
 3.7 Network Traffic Data Visibility Analysis Application(as following)
| ML-NPB-5660 Mylinking™ Network Packet Broker NPB/TAP Functional Parameters | |||
| Network Interface | 10GE(compatible with 25G) | 48*SFP+ slots; Supports single and multi-mode optical fibers | |
| 100G(compatible with 40G) | 6*QSFP28 slots; Support 40GE, breakout to be 4*10GE/25GE; Supports single and multi-mode optical fibers | ||
| Out-of-Band MGT Interface | 1*10/100/1000M electrical port | ||
| Deployment Mode | Optical Mode | Supported | |
| Mirror Span Mode | Supported | ||
| System Function | Basic Traffic Processing | Traffic Replication/aggregation/distribution | Supported |
| Based on IP / protocol / port seven-tuple traffic identification filtering | Supported | ||
| VLAN mark/replace/delete | Supported | ||
| Tunnel protocol identification | Supported | ||
| Tunnel encapsulation stripping | Supported | ||
| Port breakout | Supported | ||
| Ethernet package independence | Supported | ||
| Processing ability | 1.8Tbps | ||
| Intelligent Traffic Processing | Time-stamping | Supported | |
| Tag remove, decapsulation | Supported VxLAN、VLAN、GRE、MPLS header stripping | ||
| Data de-duplication | Supported interface/policy level | ||
| Packet slicing | Supported policy level | ||
| Supported policy level | |||
| Tunneling protocol identification | Supported | ||
| Application layer protocol identification | Supported FTP/HTTP/POP/SMTP/DNS/NTP/ BitTorrent/SYSLOG/MYSQL/MSSQL, etc. | ||
| Video traffic identification | Supported | ||
| SSL decryption | Supported | ||
| Custom decapsulation | Supported | ||
| Processing ability | 60Gbps | ||
| Diagnosis and Monitoring | Real-time monitor | Supported interface/policy level | |
| Traffic alarm | Supported interface/policy level | ||
| Historical traffic review | Supported interface/policy level | ||
| Traffic capture | Supported interface/policy level | ||
| Traffic Visibility Detection | Basic Analysis | Summary statistics are displayed based on basic information such as packet count, packet category distribution, number of session connections, and packet protocol distribution | |
| DPI Analysis | Supports transport layer protocol ratio analysis; unicast broadcast multicast ratio analysis, IP traffic ratio analysis, DPI application ratio analysis. Support data content based on sampling time analysis of traffic size presentation. Supports data analysis and statistics based on session flow. | ||
| Accurate Fault Analysis | Supported fault analysis and location based on traffic data, including packet transmission behavior analysis, data flow level fault analysis, packet level fault analysis, security fault analysis, and network fault analysis. | ||
| Management | CONSOLE MGT | Supported | |
| IP/WEB MGT | Supported | ||
| SNMP MGT | Supported | ||
| TELNET/SSH MGT | Supported | ||
| RADIUS or TACACS + Centralized authorization authentication | Supported | ||
| SYSLOG protocol | Supported | ||
| User authentication | Based on user’s password authentication | ||
| Electric(1+1 Redundant Power System-RPS) | Rate power supply voltage | AC110~240V/DC-48V(optional) | |
| Rate power supply frequency | AC-50HZ | ||
| Rate input current | AC-3A / DC-10A | ||
| Rate power | Max 400W | ||
| Environment | Working temperature | 0-50℃ | |
| Storage temperature | -20-70℃ | ||
| Working humidity | 10%-95%no condensation | ||
| User Configuration | Console configuration | RS232 interface, 115200,8,N,1 | |
| Password authentication | Supported | ||
| Height of Chassis | Rack space (U) | 1U 445mm*44mm*402mm | |
